Facility Specifications

Image Air ducts on the ceiling of a hallway.

Technical and Environmental Performance 
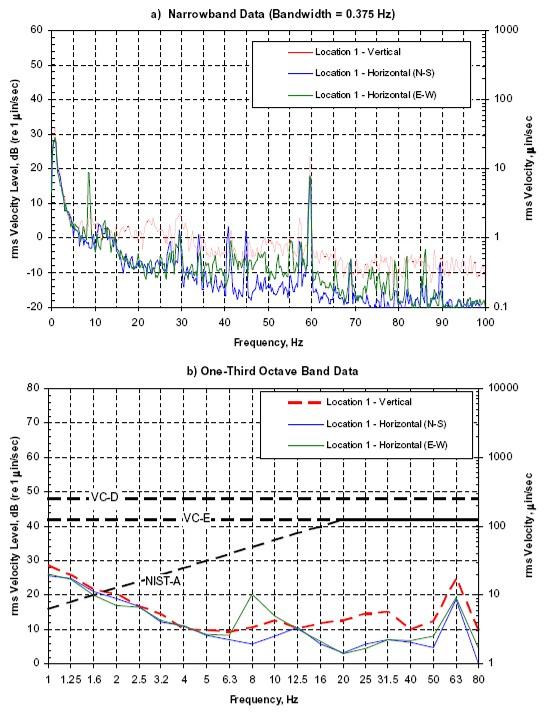
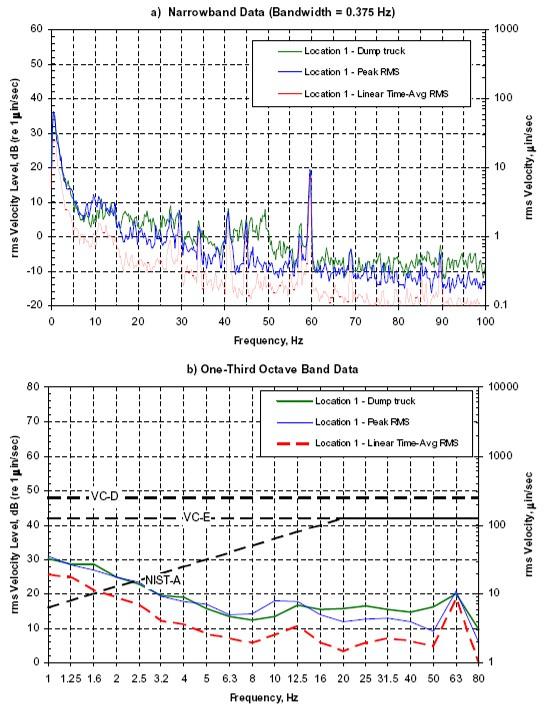
Vibration Control 

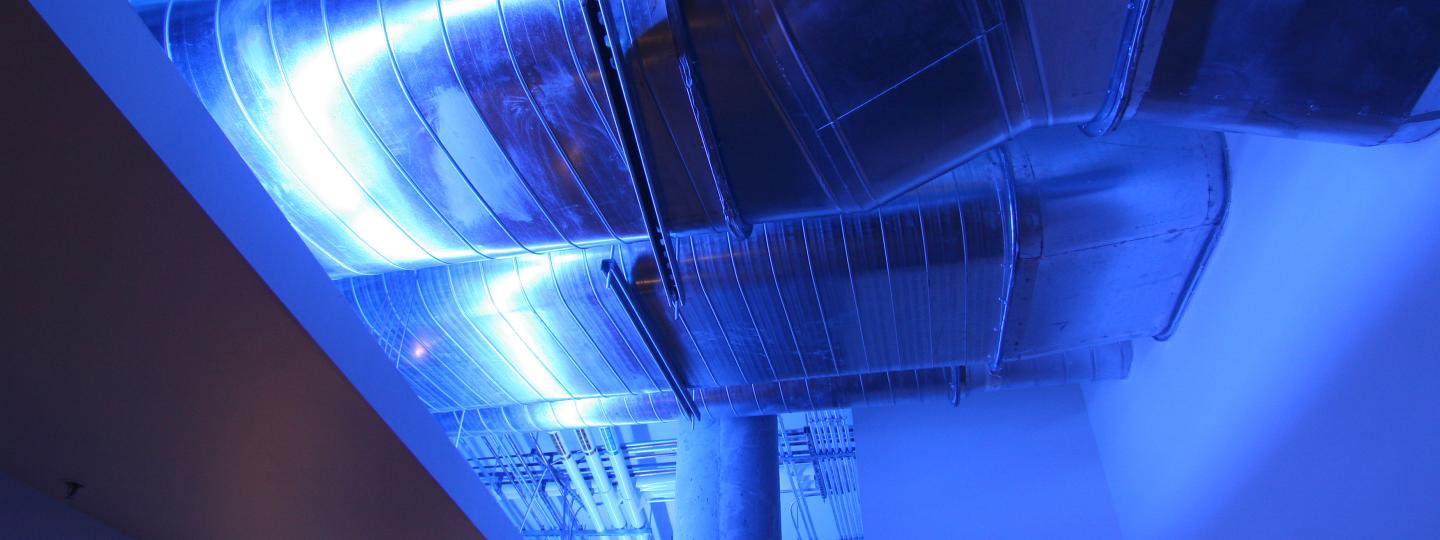
The foundation of our laboratory is poured directly on Eugene Formation bedrock, which exhibits an unusually high damping coefficient, resulting in a vibration level that exceeds the NIST-A criteria requirement for nanotechnology by a factor of two to four (depending on the frequency). Large cross-section, round ducting and low-flow diffusers also reduce HVAC vibrations. 

Image Line graph of vibration data showing that the amount of vibration in the facility tends to be very low.
UO ISC Follow-up Vibration Survey: August 13, 2007
Triaxial, Ambient, Linear Average RMS 
Location 1, TEM Room (97E) 
Image Line graph of vibration data showing that vibrations generated by different sources, including a dump truck, lie well below the NIST-A level.
UO ISC Follow-up Vibration Survey: August 13, 2007
Horizontal (N-S), Truck Generated Vibration, Peak Hold RMS 
Location 1, TEM Room (97E) 

EMI Shielding 

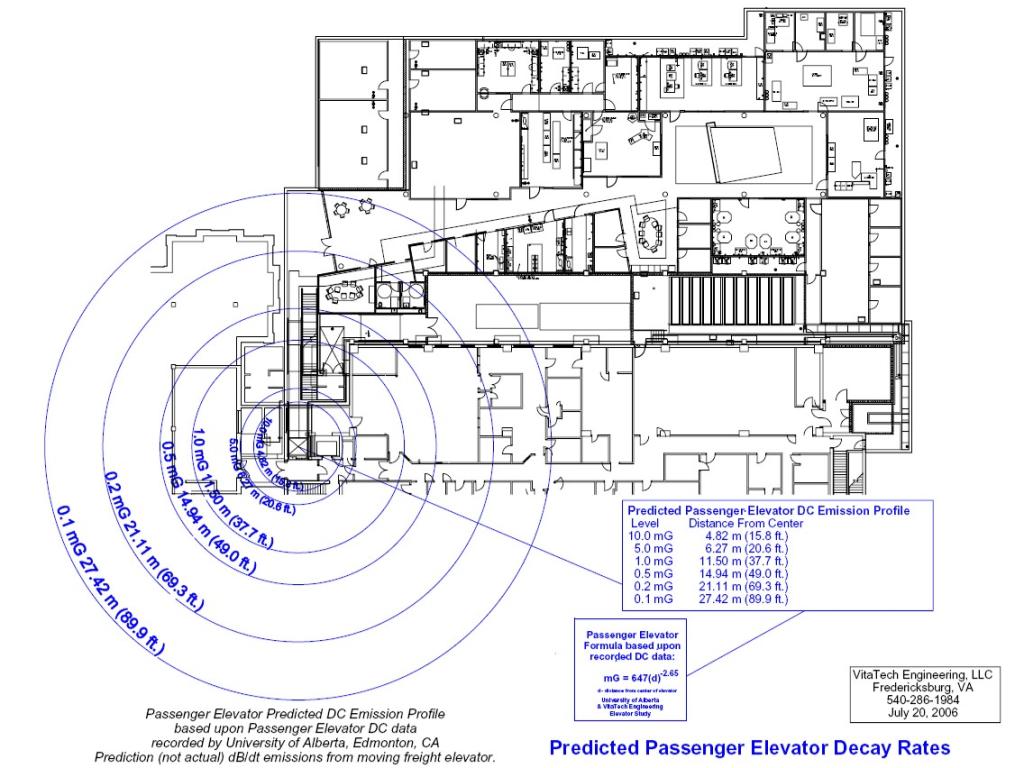
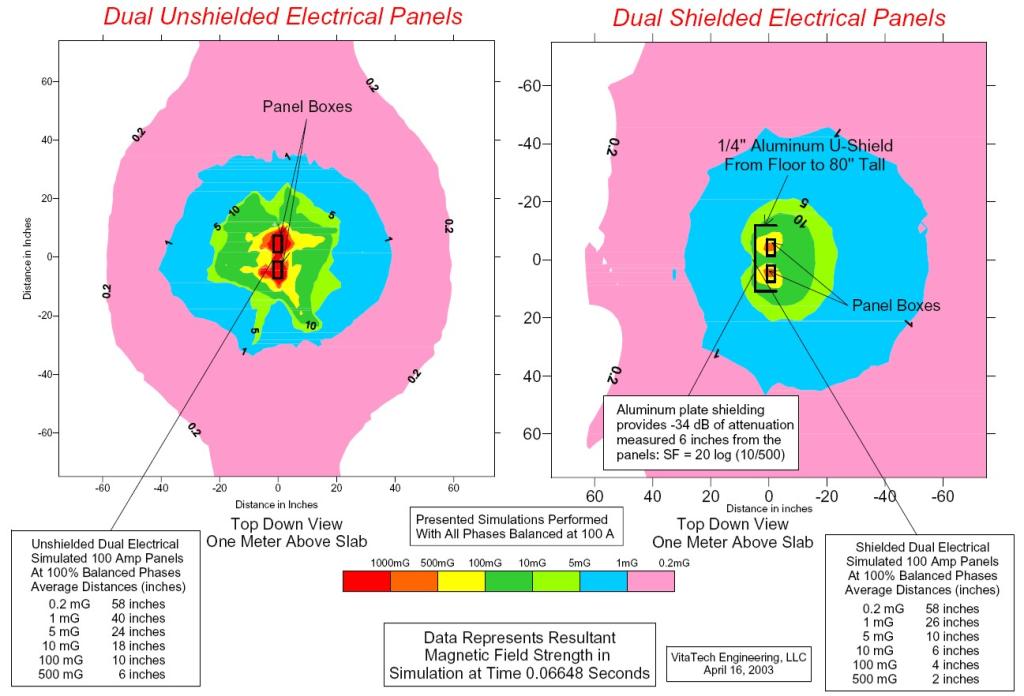
Extensive shielding for electromagnetic interference (EMI), including all steel conduit, additional power panel shielding, no overhead electrical power, low-noise earth grounding rods, and isolated and insulated rebar in foundation to avoid ground loops. 

Image A floorplan of the CAMCOR facility showing that there is a low amount of predicted electromagnetic interference from the elevator.
Predicted passenger elevator emission profile impact.
Image Graph showing the magnetic field levels of panelboards with and without shields, demonstrating that shielded panels produce a less intense and more uniform field.
Simulated AC ELF magnetic field levels of dual 100 Amp panelboards horizontal cut planes at 1-meter elevations.

Temperature Control

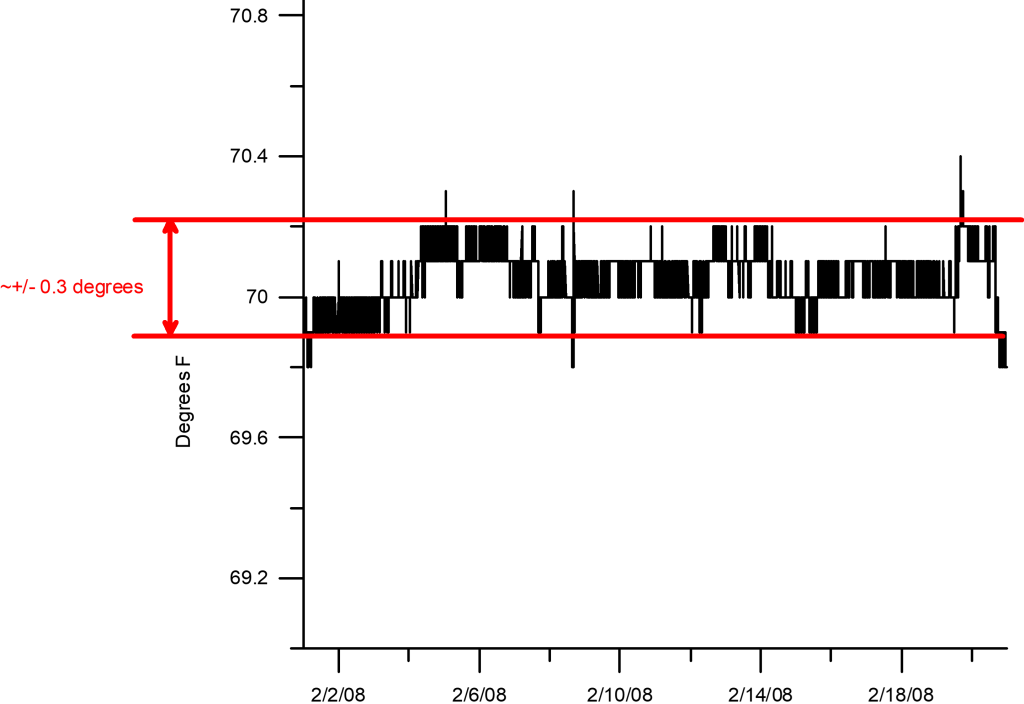
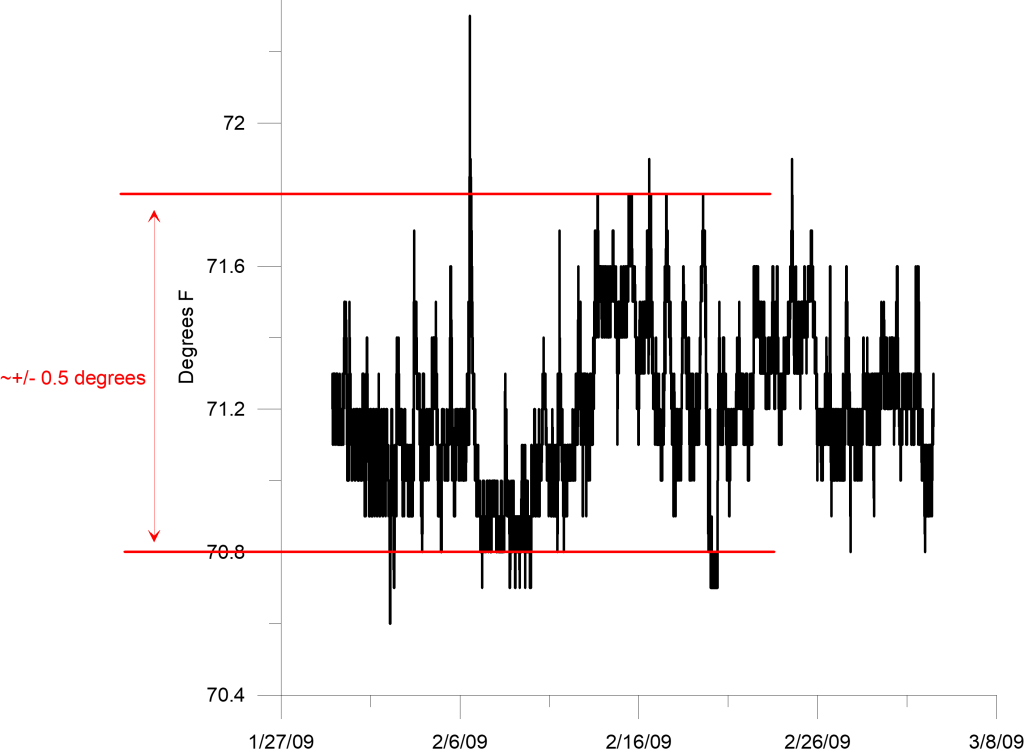
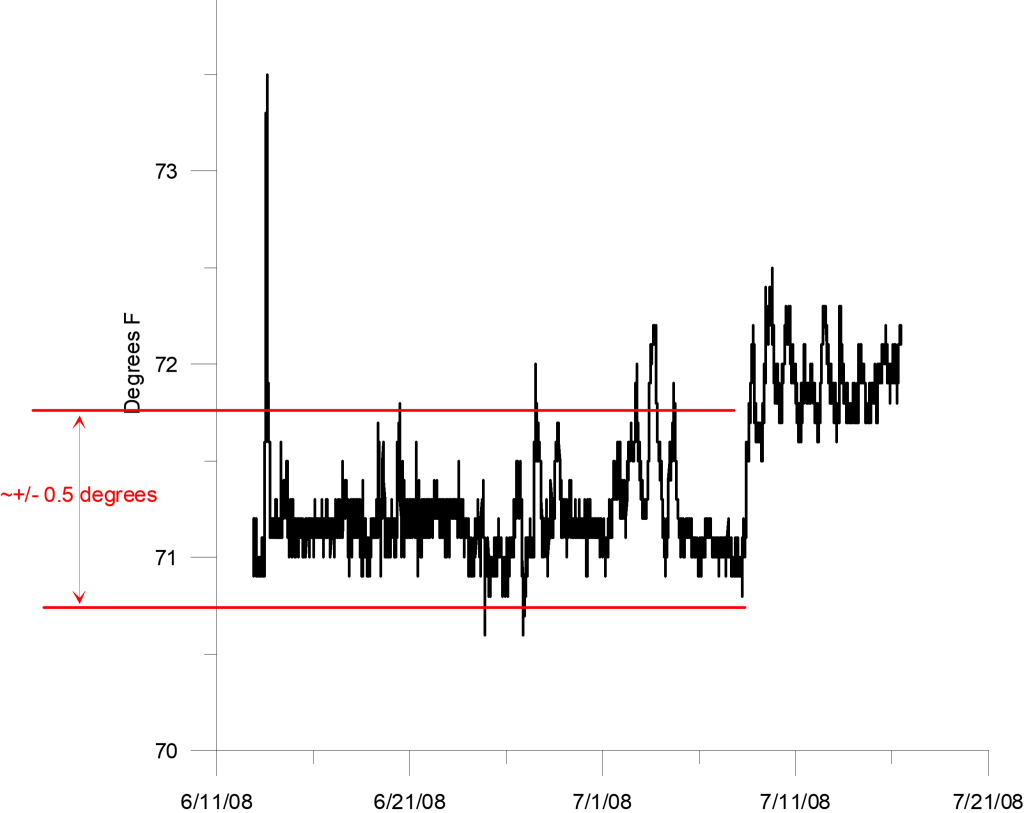
Precise temperature control throughout the analytical facilities is better than +/- 0.5 degrees F (better than 0.2% in the TEM lab). This provides ultra-stable instrument performance to attain ultimate spatial resolution and minimal instrument drift for high accuracy quantitative measurements. 

Image Graph of temperature over the span of two weeks where temperature does not change more than 0.3 degrees F in the High-Resolution Analytical Facility.
Temperature stability record from High-Resolution Analytical Facility. 
Image Graph of temperature over time, where temperature does not change more than 0.5 degrees F in the Nanofabrication and Imaging Facility.
Temperature stability record from Nanofabrication and Imaging Facility. 
Image Graph of temperature over time, where temperature generally does not change more than 0.5 degrees F in the MicroAnalytical Facility..
Temperature stability record from MicroAnalytical Facility. 

Dust Management

Dust control measures include gradient air pressure room differentials (clean to less clean), HEPA filtration, and sticky mats. 
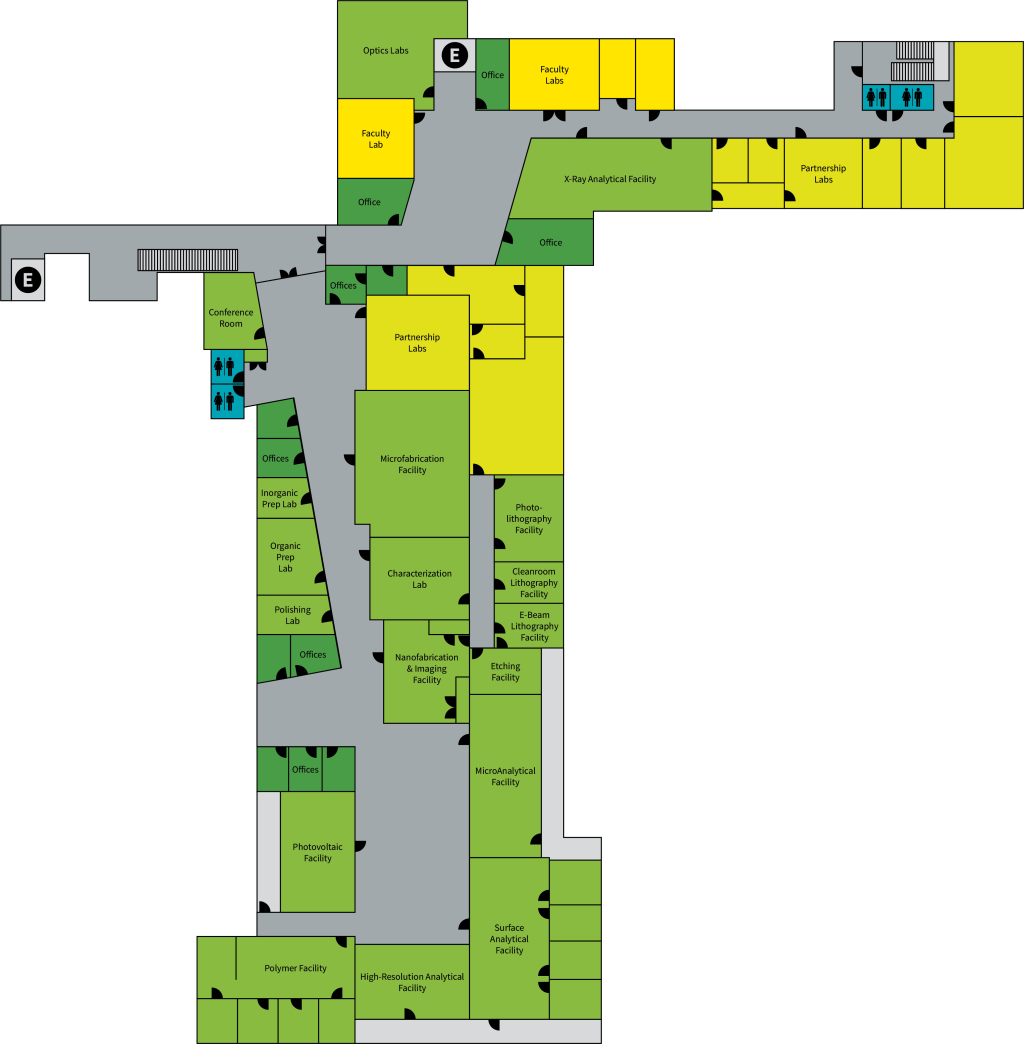
Floor Plan

Our 40,000-square-foot facility comprises more than a dozen laboratories for characterization and fabrication instrumentation. Additional spaces are available for lease to industrial partners. 

Image Floorplan of CAMCOR.